

See where your cash runs tight, before it does. Plug in seven numbers, get your runway, your tightest week, and what changes when customers pay a few days sooner. Or download the full 8-tab Excel for customer-level detail.
Real-time forecast. Tightest-week alerts. What-if slider for faster customer payments. No signup, no signin, no data leaves your browser.
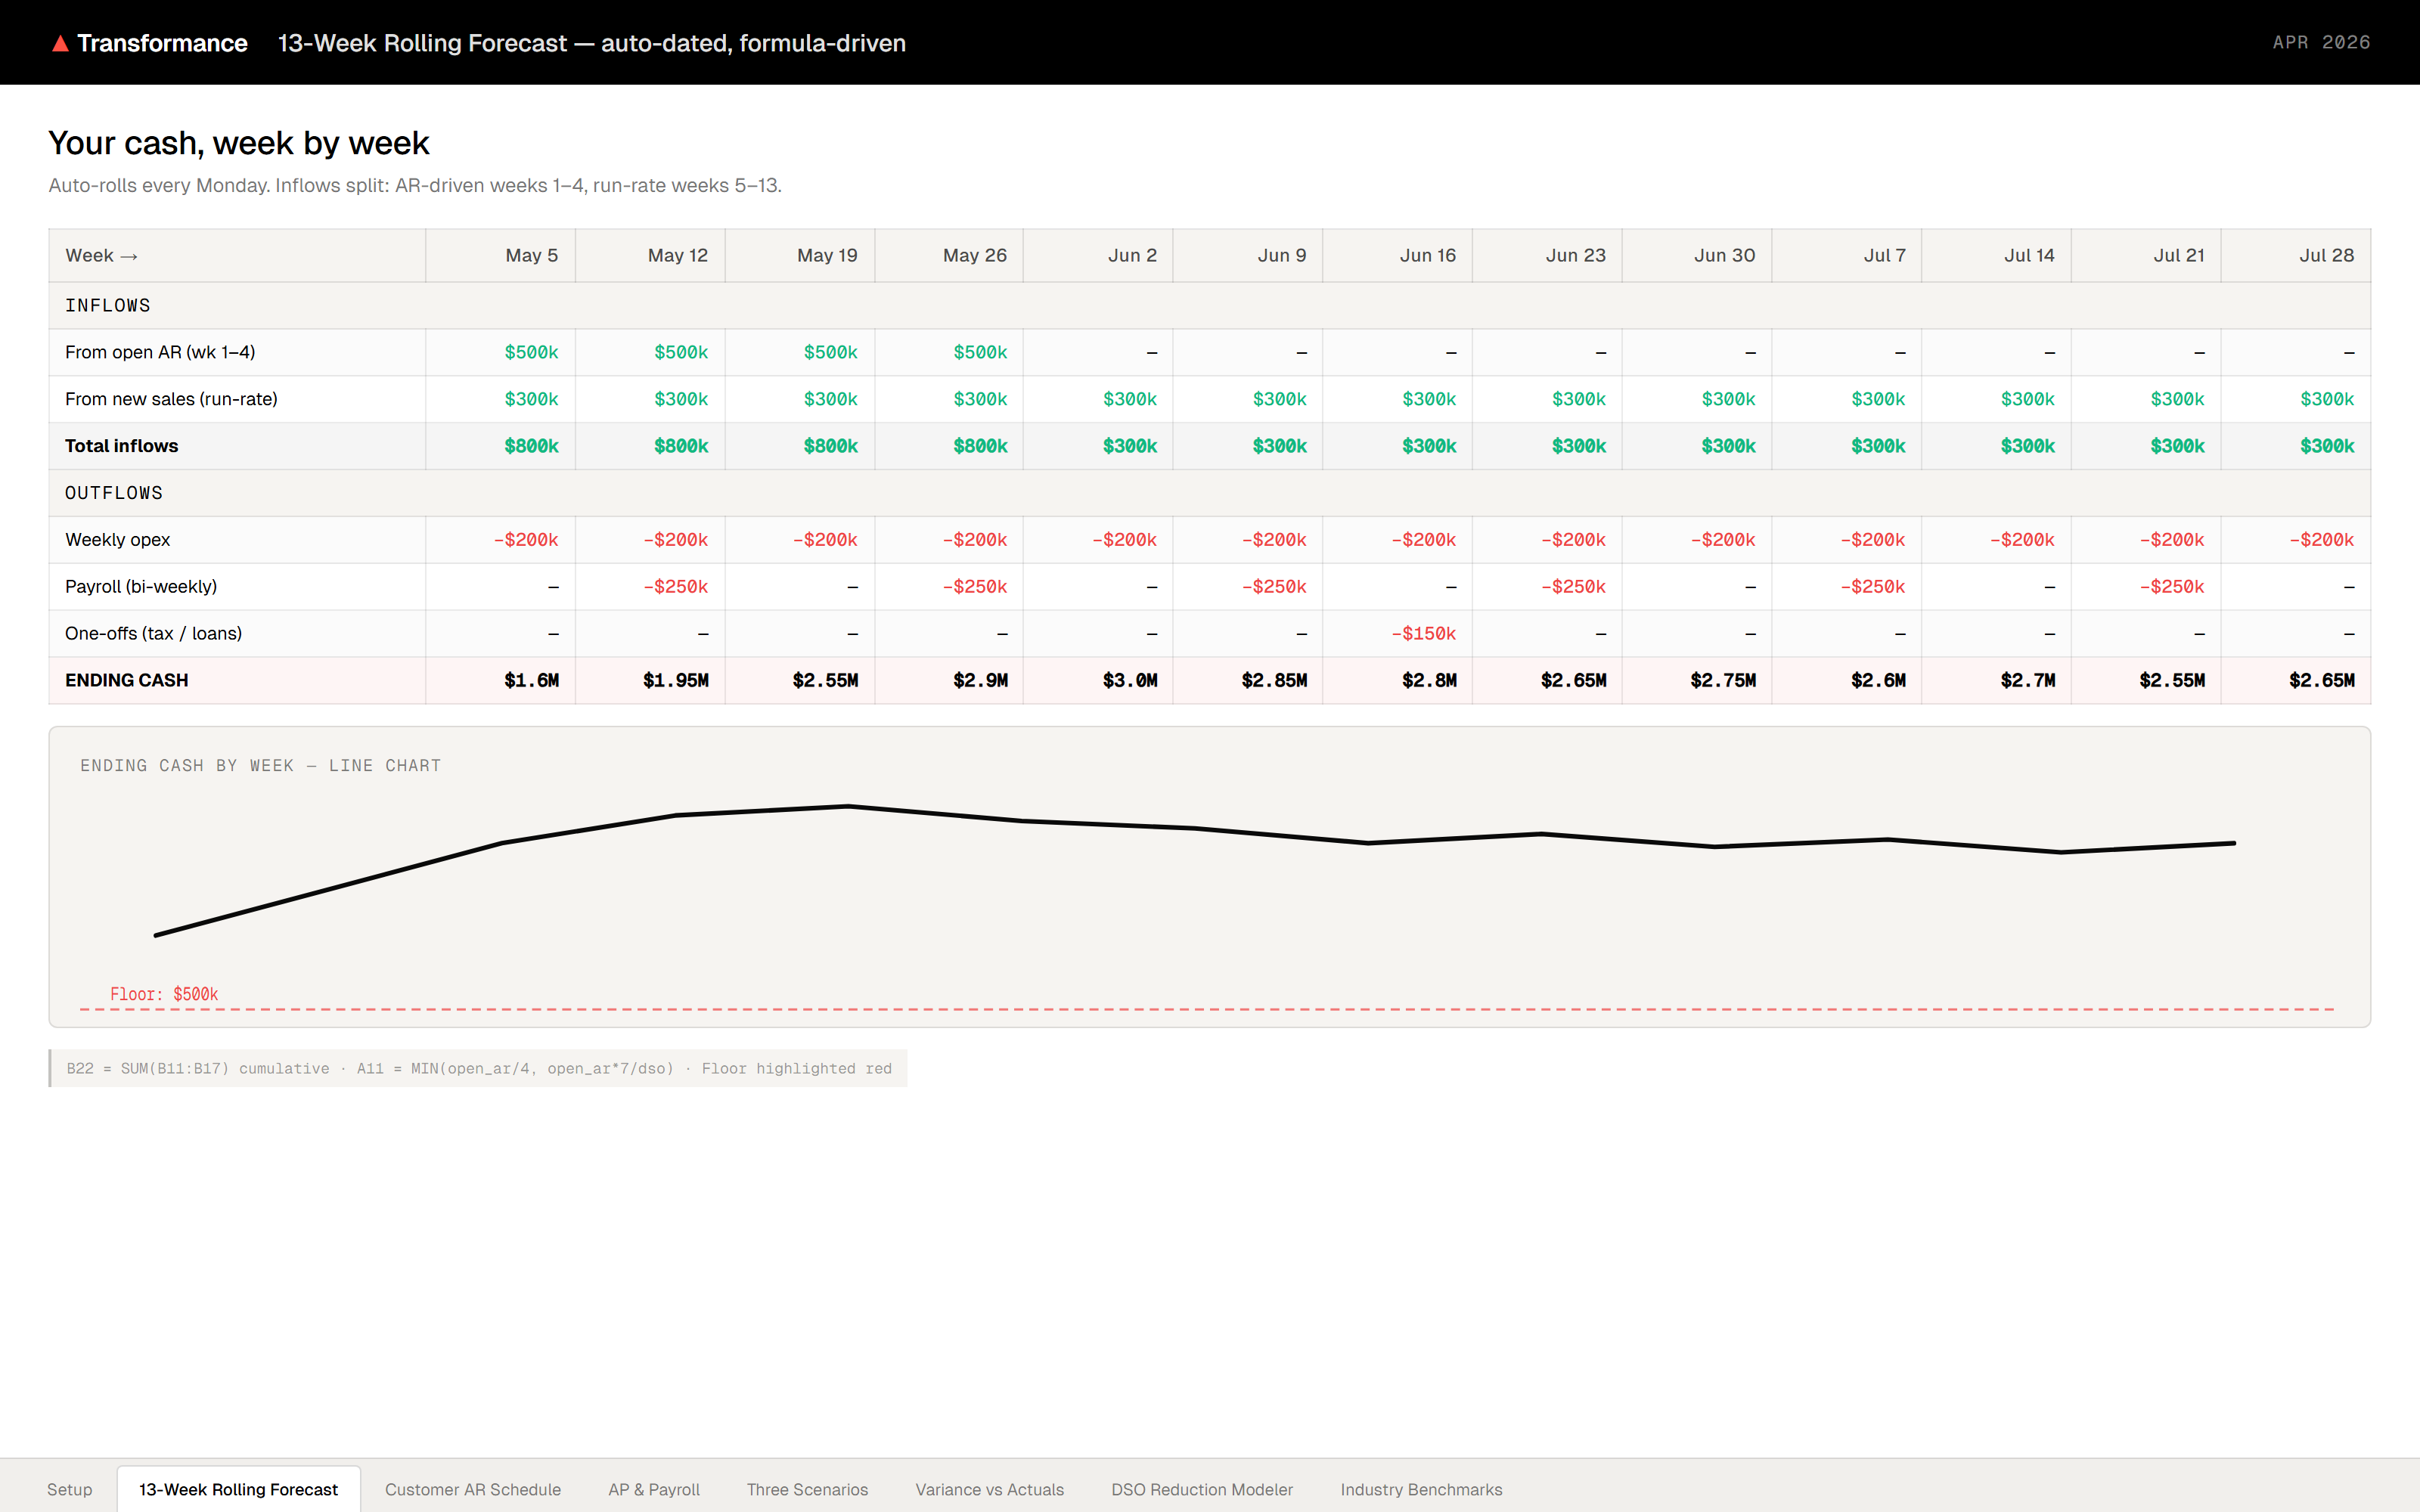
Next 13 weeks. Red zone is below your floor.
How this works: The first 4 weeks come from invoices already on your books, so confidence is high. Weeks 5 to 13 use your weekly run-rate as an estimate. Download the 8-tab Excel below to plug in real customer-by-customer numbers.
Driven by invoices already on your books. Treasury-grade accuracy where it matters most.
Your weekly cadence projected forward. Tightest-week alerts highlight where cash dips below your floor.
Move customer payment timing and watch the tightest week jump in real time. No model rebuild.
Treasury teams standardised on 13 weeks because it covers a full quarter of payroll cycles plus quarterly tax payments, while keeping forecast accuracy high in the early weeks.
AFP 2025 Treasury Survey: top teams hit 90% accuracy at the 1-week mark. That is why we split the forecast into a high-confidence first month and a run-rate estimate after.
A full quarter of payroll cycles plus quarterly tax payments. Long enough to spot cash crunches early, short enough to stay accurate.
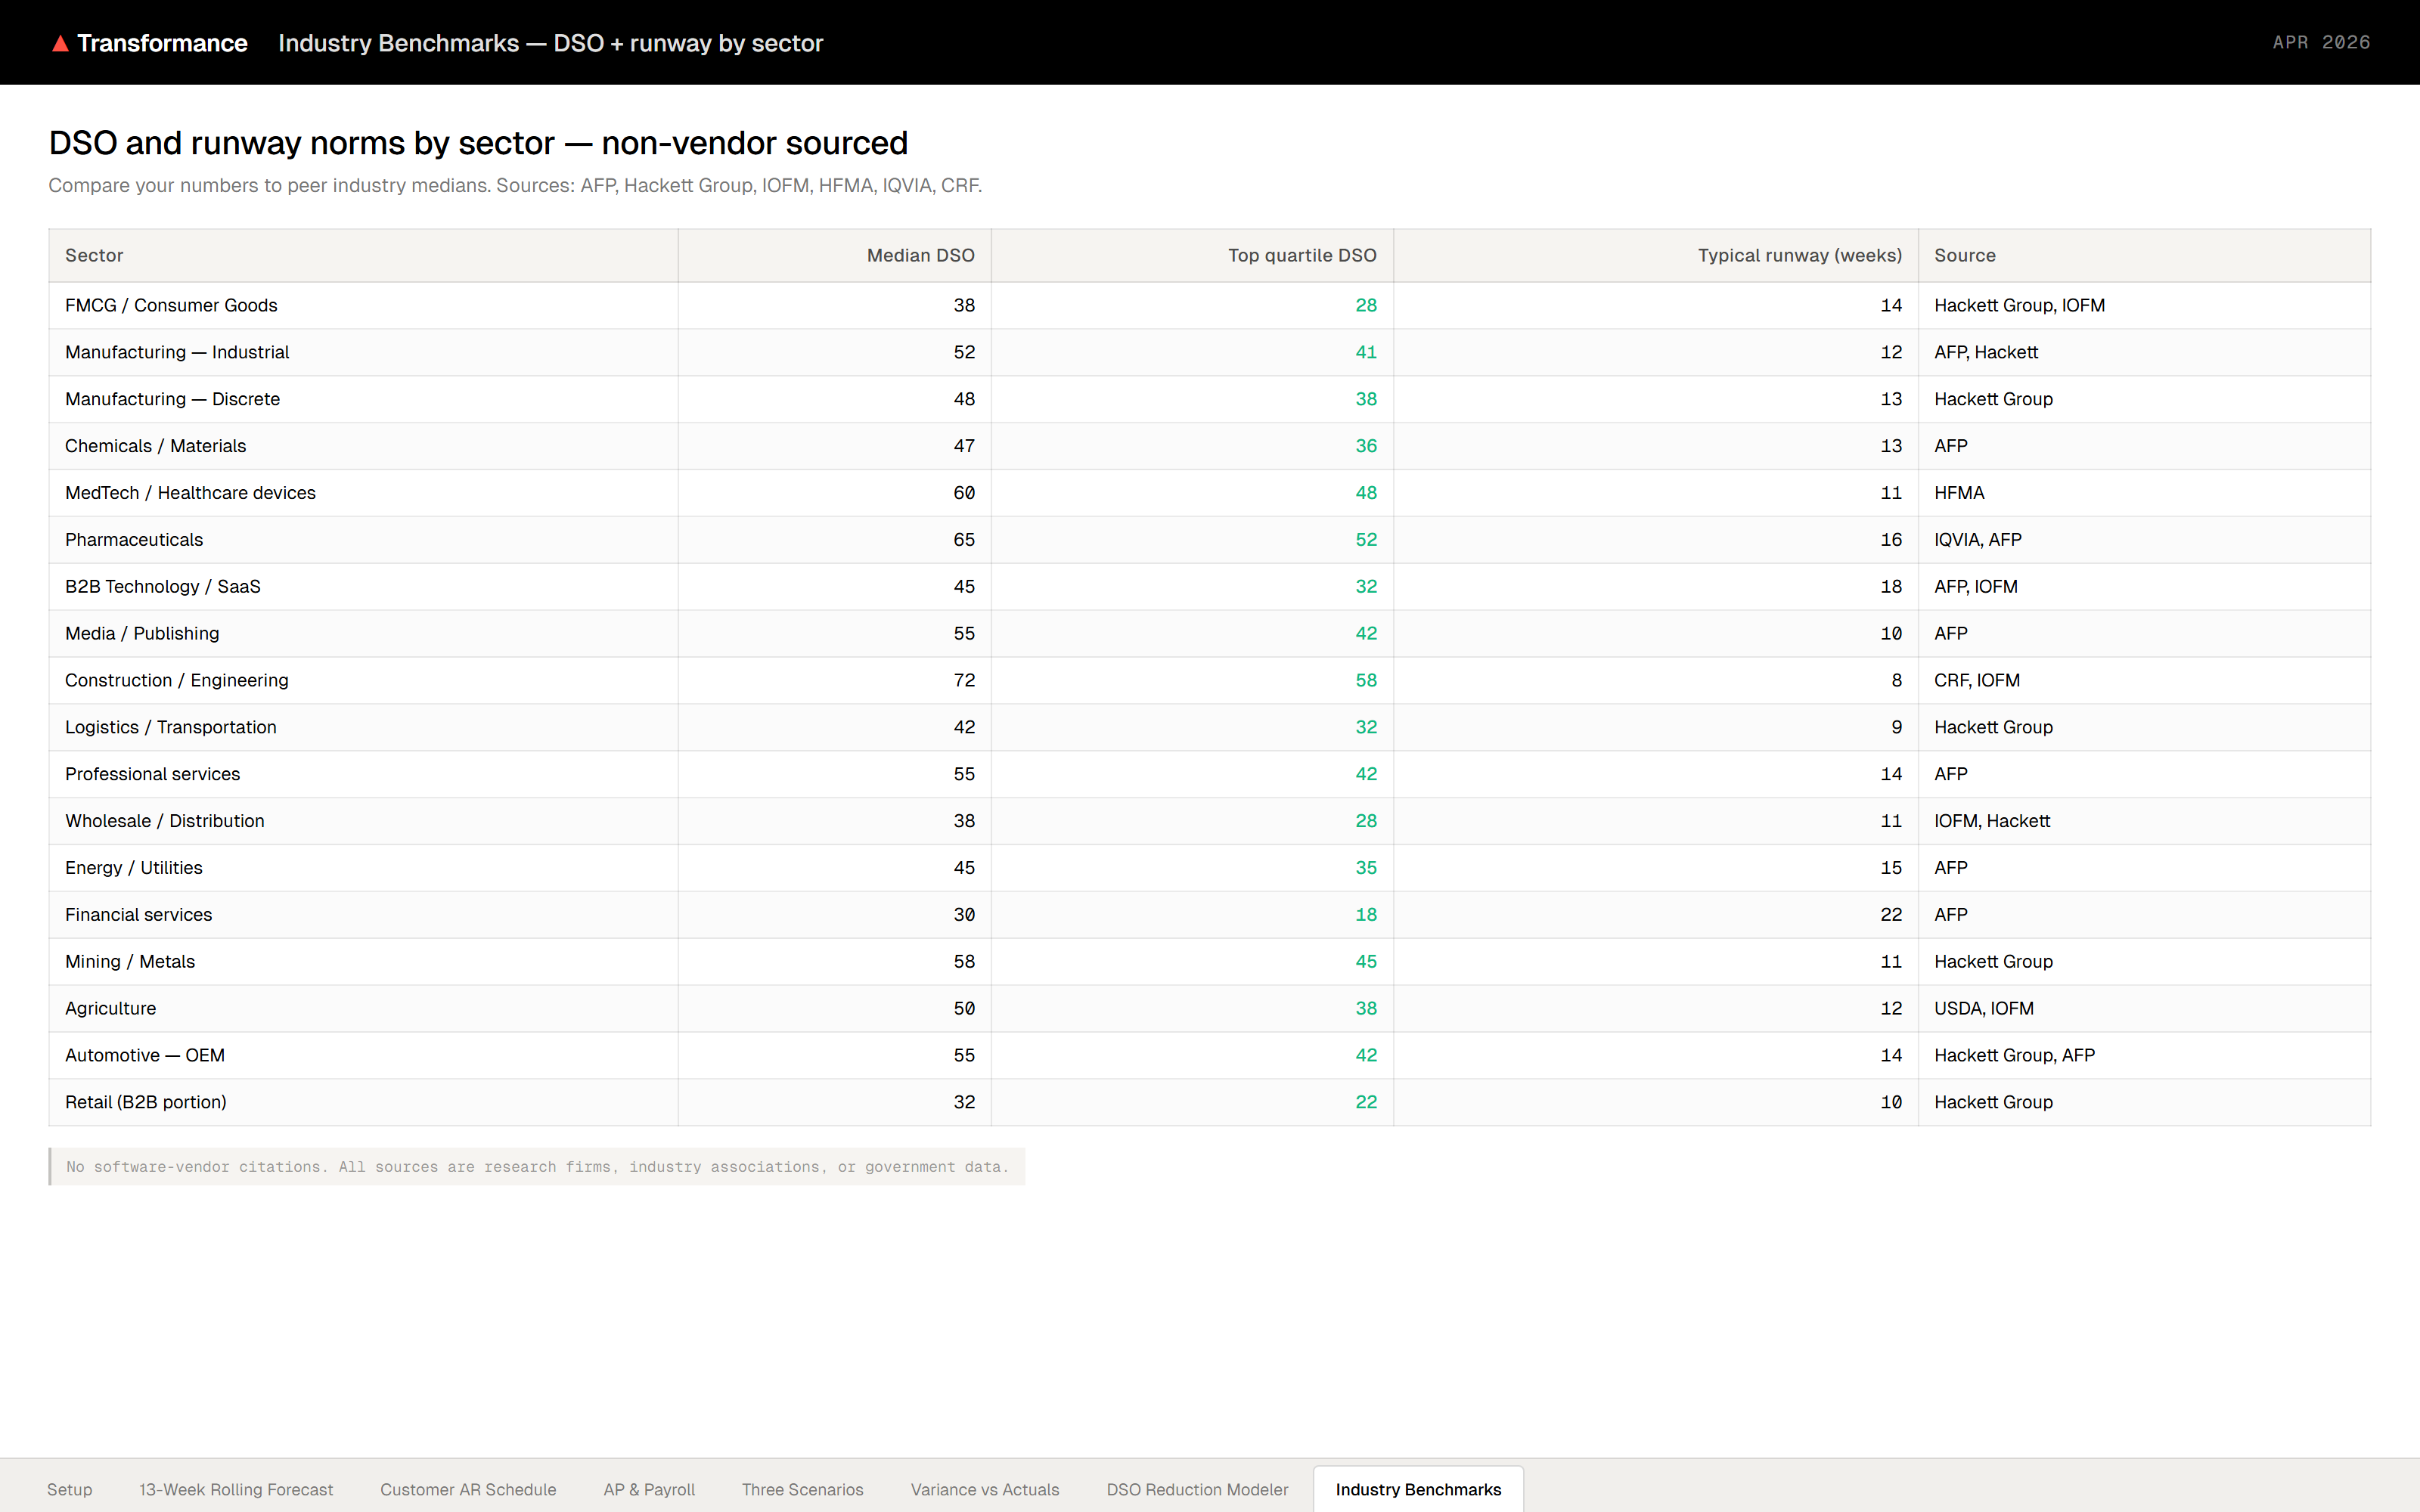
Typical DSO improvement when AR teams move from manual collections to 100%-coverage workflow. The what-if slider above shows exactly what those days are worth to you.
Customer-by-customer AR detail, three-scenario fan chart, variance-vs-actuals tracker, and a DSO reduction modeler that targets your slowest payers.
 13-Week Rolling Forecast
 Customer AR Schedule
 DSO Reduction Modeler
 Variance vs Actuals
 Industry Benchmarks
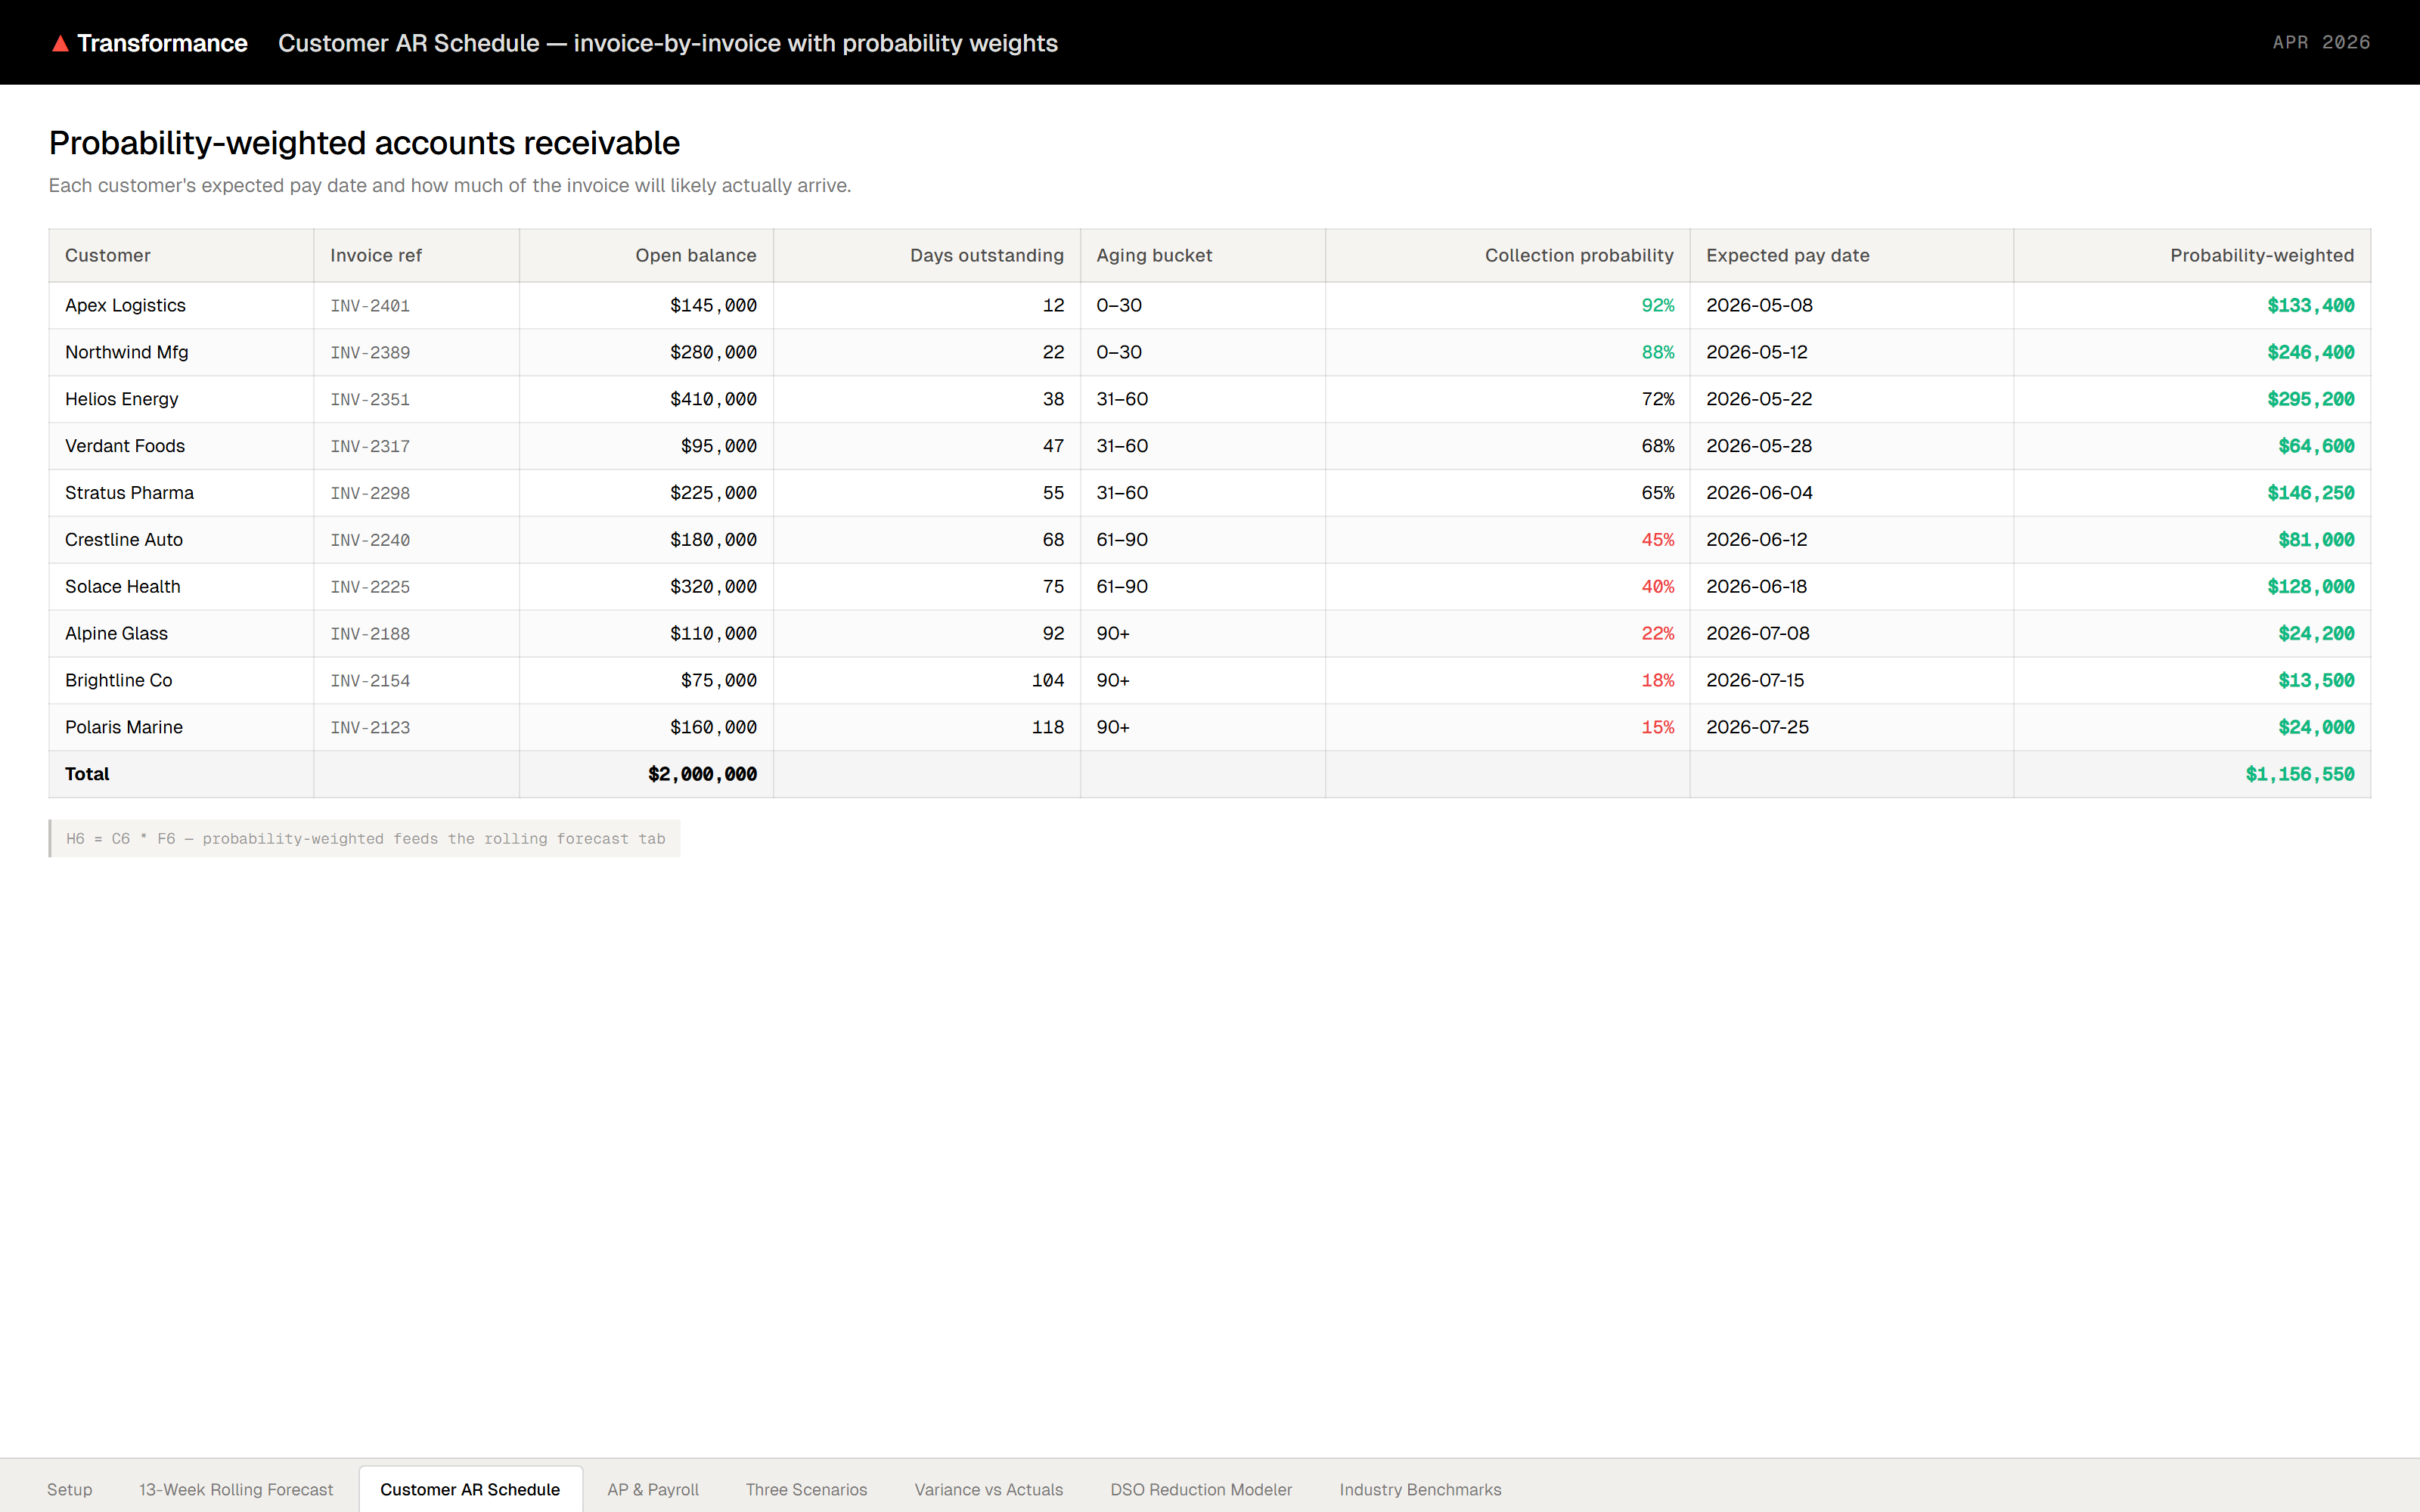
Customer-by-customer detail. Variance tracking that sharpens your forecast every week.
Live AR/AP feeds, ML-driven customer payment predictions, and continuous re-forecasting at multi-entity scale. The model gets sharper every week without anyone touching a spreadsheet.


Per-customer payment probability models, retrained continuously on your AR history. No more average DSO assumptions.
Multi-entity, multi-currency rollups from SAP, Oracle, NetSuite or any system. Forecast updates as actuals land.
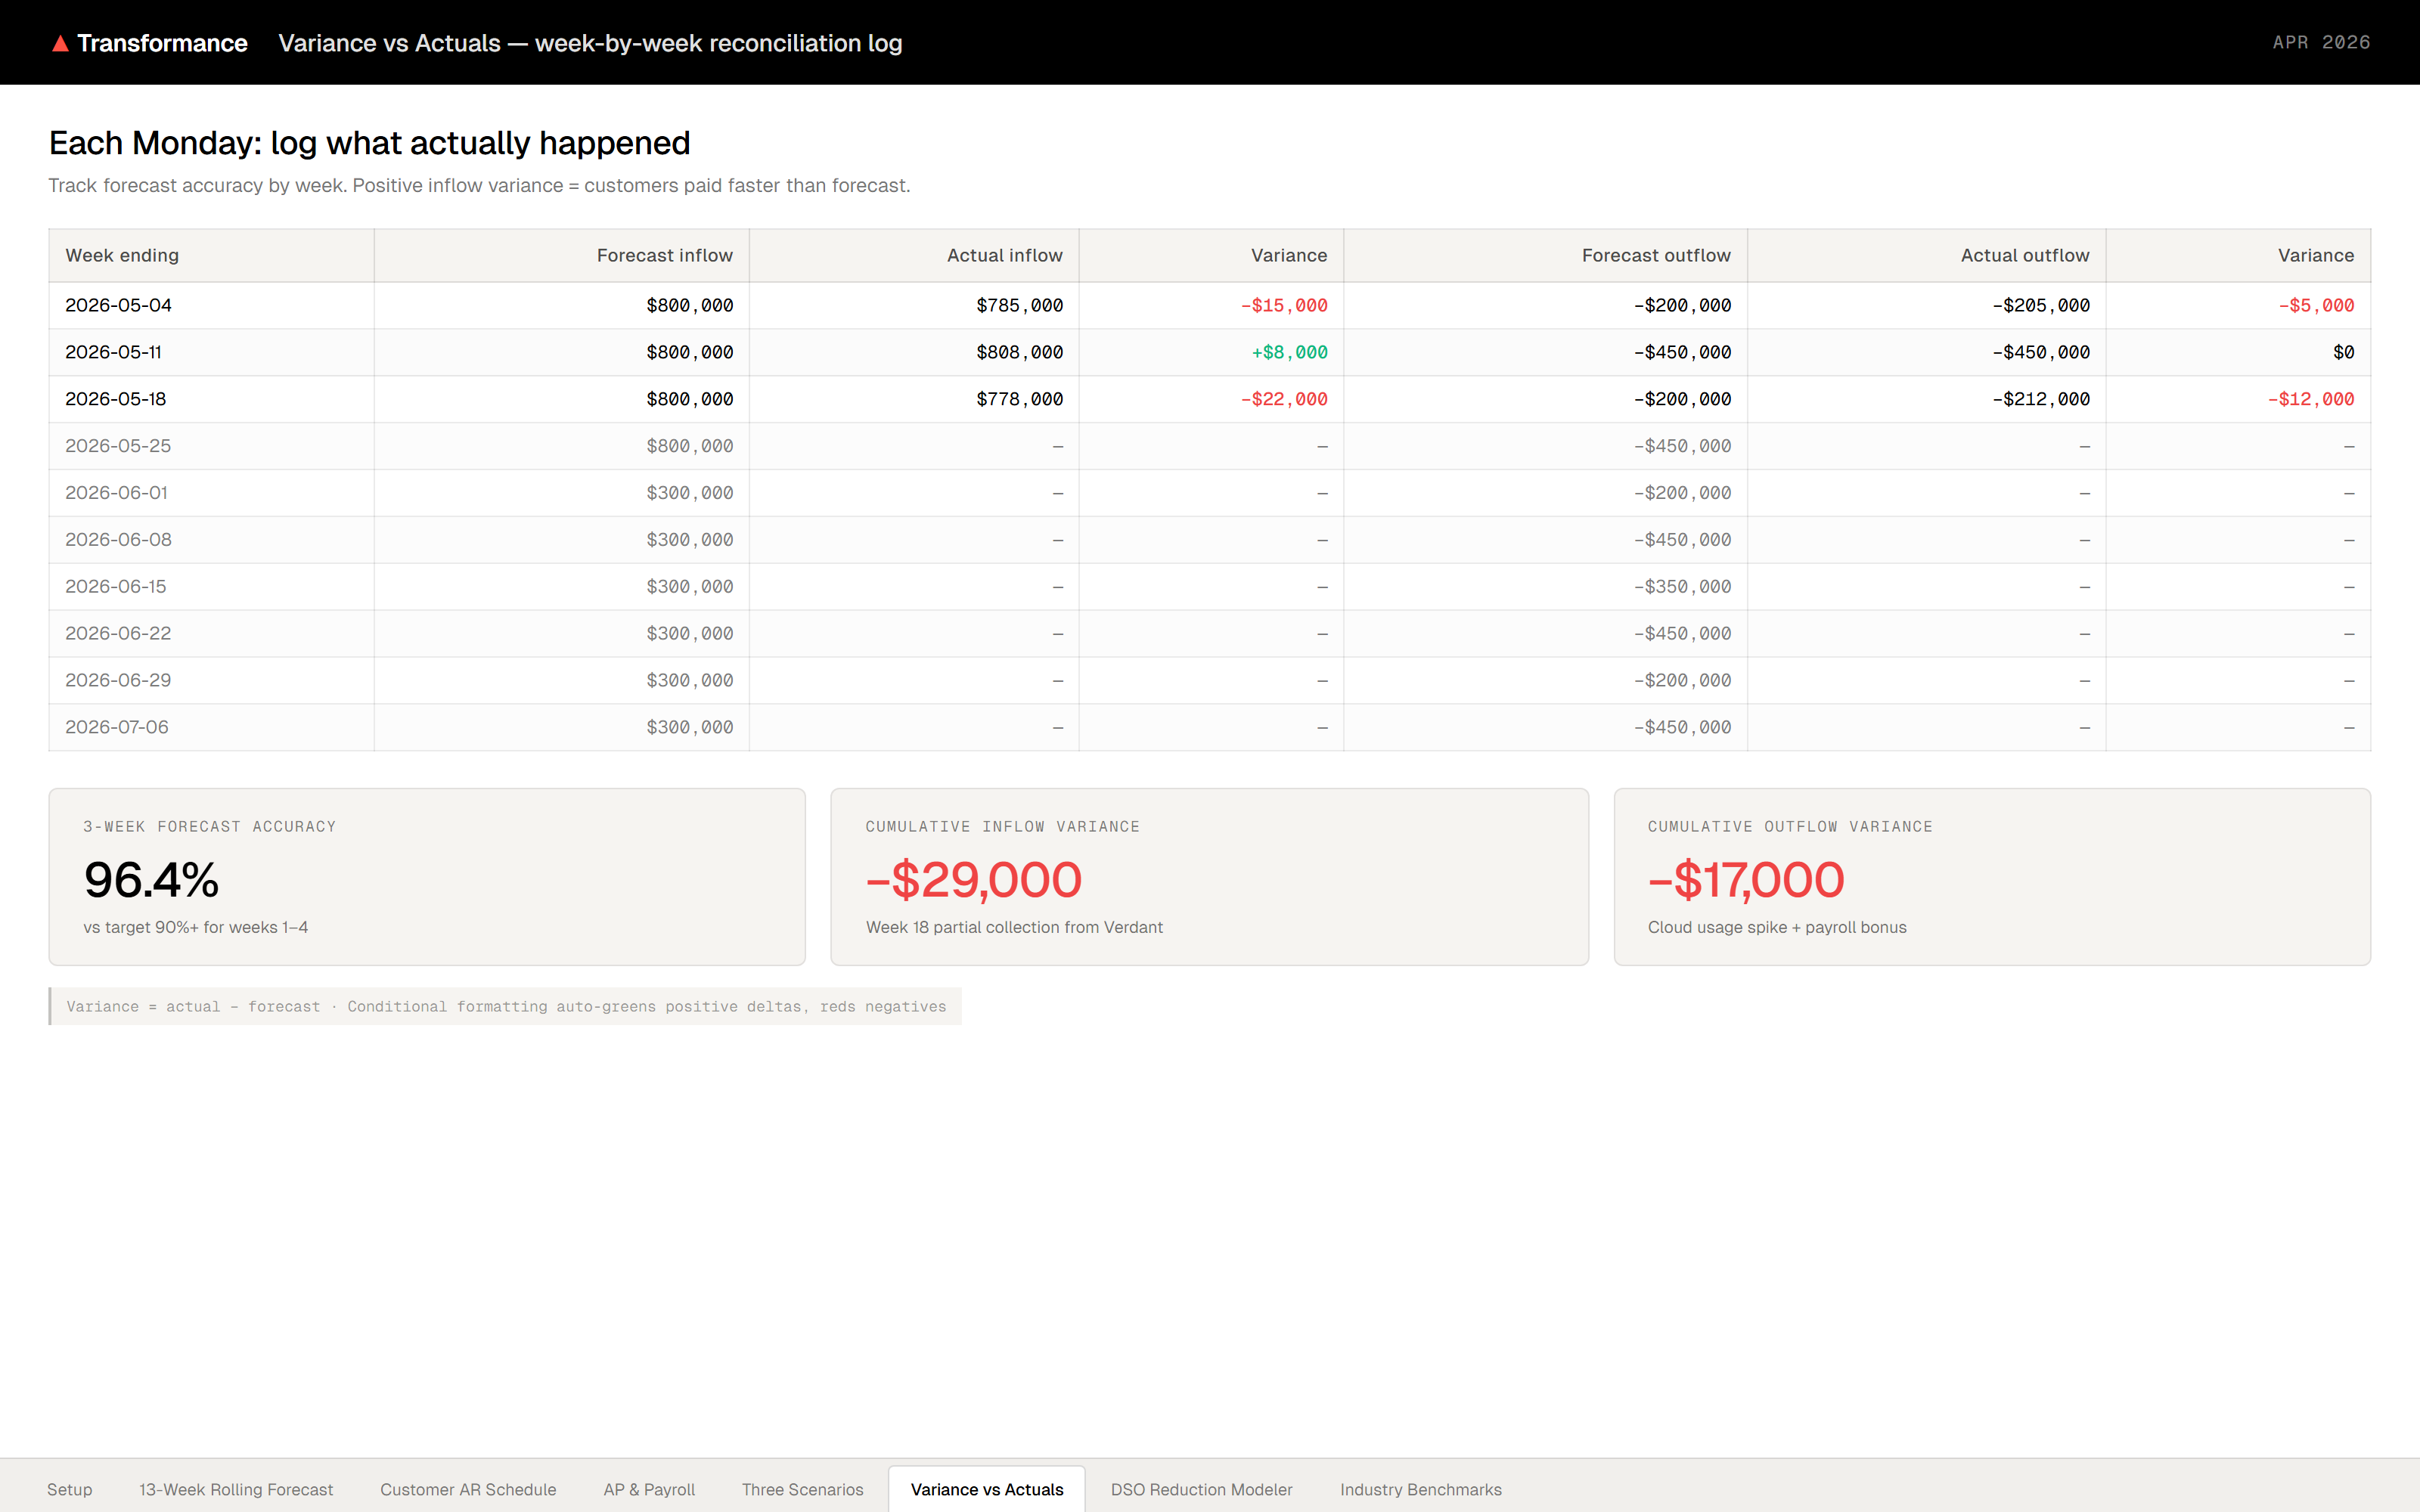
When the week comes in different, CashPulse tells you which driver moved: collections timing, new sales, or unplanned outflow.


A 13-week cash flow forecast is a weekly view of money coming in and going out over the next quarter. It uses the direct method, meaning actual customer payments, payroll dates, and vendor invoices rather than accrual accounting, so it shows real cash timing. Each week you drop the past one and add a new week ahead, keeping the rolling 13-week window. It is the standard tool finance teams use to spot cash shortfalls early enough to do something about them.
A 13-week cash flow forecast covers a full fiscal quarter. That is long enough to see major events like quarterly tax payments, board commitments, and debt covenants, but short enough that recent history is still a reliable predictor. Daily forecasts are too noisy; monthly forecasts hide weekly cash crunches. Restructuring practitioners standardised on 13 weeks because it covers a complete payroll cycle plus quarter-end events while keeping accuracy high in the early weeks.
Use the direct method for weekly cash flow forecasts. It lists actual cash inflows (customer collections by week) and outflows (payroll, AP, rent) at the dates they hit your account, which matches how short-term liquidity actually behaves. The indirect method starts from net income and adjusts for non-cash items. Better for monthly profit planning, worse for catching a Tuesday payroll squeeze. Direct method equals liquidity forecasting. Indirect method equals profitability planning.
Top treasury teams hit 90%+ accuracy in weeks 1 to 4 of a 13-week cash flow forecast, dropping to around 60 to 70% by week 13. The drop-off is why this tool splits the forecast into a high-confidence early month (driven by invoices already on your books) and a run-rate estimate after. The point is not perfect prediction. It is spotting which week is tight and what would move it: faster AR collection, delayed AP, or a line draw.
Update your cash flow forecast weekly. Every Monday: drop last week, log what actually came in and out, add a new week 13 at the far end. This rolling cadence is the single biggest accuracy lever. Forecasts reconciled against actuals get sharper every week, while static templates drift further from reality. The Excel template above includes a variance sheet built exactly for this loop.
Excel cash flow forecast templates work for steady-state businesses with a single entity and a treasurer who can refresh them weekly. They are free, flexible, and good enough up to roughly $50 to 100M revenue. Cash flow forecasting software pulls live AR/AP/ERP data automatically, runs ML on customer payment patterns, and handles multi-entity and multi-currency rollups. Necessary at enterprise scale, where manual reconciliation breaks down. Start with the Excel above, scale to CashPulse when the model can no longer keep up.
Use the calculator and Excel above to start. When the model outgrows the spreadsheet, CashPulse picks it up.
