The hard part isn't the spreadsheet. It's the input data. Most 13-week forecasts miss by 15-25% because the especially the AR side is built on stale ERP snapshots and gut-feel assumptions. Transformance CashPulse forecasts net cash from your real AR and AP data using granular, multi-horizon models, with 90 to 95% accuracy out to 90 days and known future inputs like FX rates and commodity futures feeding the forecast directly. Live payment matches from ClearMatch, recorded promises from CollectPulse, and dispute status from ClaimIQ all flow into the forecast in real time. Deploys in 4 to 8 weeks with no template configuration.
Key Takeaways
- A 13-week cash flow forecast (TWCF) projects weekly inflows and outflows over 90 days using the direct method, not accruals.
- Forecast accuracy depends almost entirely on the quality of the upstream AR data: which invoices will pay, which are disputed, and which carry promise-to-pay dates.
- According to PwC’s 2024 Working Capital Study, companies with weekly forecasting reduce DSO by 6-12 days compared to monthly-only cycles.
- Transformance’s CashPulse builds forecasts from processed AR data (matched payments, recorded promises, flagged disputes) instead of raw ERP snapshots, with deployments live in 4-8 weeks.
- The free template below covers receipts, disbursements, financing, and a rolling variance log so you can track forecast-to-actual every Friday.
In This Article
- Key Takeaways
- What Is a 13-Week Cash Flow Forecast?
- How Does the 13-Week Cash Flow Forecast Work?
- Why Are Most 13-Week Forecasts Inaccurate?
- How to Build a 13-Week Cash Flow Forecast: Step-by-Step
- What Drives Forecast Accuracy: AR Data Quality
- 13-Week Cash Flow Forecast vs. Traditional Approaches
- Free 13-Week Cash Flow Forecast Template
- How AI Improves 13-Week Cash Flow Forecast Accuracy
- Common Mistakes to Avoid
What Is a 13-Week Cash Flow Forecast?
A 13-week cash flow forecast is a short-term liquidity model that projects weekly cash receipts and disbursements across 13 consecutive weeks (one fiscal quarter). It uses the direct method, recording actual cash movements rather than accrual-based revenue and expense entries. Finance teams use it to manage working capital, identify covenant risks, plan financing, and prepare for restructuring or growth scenarios.
The 13-week window is the standard because it balances granularity against forecast horizon. Weekly buckets are detailed enough to catch a payroll-week cash crunch. Thirteen weeks is long enough to plan a debt paydown, a vendor renegotiation, or a capital raise.
According to a 2024 AFP Liquidity Survey, 71% of treasurers run a rolling 13-week forecast. It’s the single most common short-term cash discipline in corporate finance.
How Does the 13-Week Cash Flow Forecast Work?
The model is a weekly worksheet with three blocks: opening cash, receipts, disbursements, financing activities, and closing cash. Each Friday, the prior week’s actuals replace the forecast, and a new Week 13 is added. The forecast rolls forward continuously.
The Three Building Blocks
Block 1: Opening cash position. Pulled from bank balances, net of any restricted cash. This is your starting point each week.
Block 2: Operating receipts and disbursements. Receipts come from AR collections, intercompany settlements, tax refunds, and other inflows. Disbursements include payroll, AP, rent, freight, taxes, and recurring expenses.
Block 3: Financing and investing. Debt drawdowns, paydowns, capex, M&A consideration, dividends. These are typically lumpy and known weeks in advance.
Direct vs. Indirect Method
The 13-week forecast almost always uses the direct method. You’re modeling cash, not earnings. An indirect-method forecast (start with net income, adjust for non-cash items) is fine for annual planning but useless for next-week liquidity decisions.
The direct method requires you to know, week by week, which invoices will be collected, which payments will clear, and what the bank statement will show on Friday afternoon. That’s where most forecasts break down.
Why Are Most 13-Week Forecasts Inaccurate?
Most forecasts miss because the AR inflow assumption is guesswork. The treasury team copies last quarter’s collection pattern, applies a seasonality adjustment, and hopes for the best. The result: forecast variance of 15-25% on weekly receipts, which compounds across 13 weeks into a forecast that’s directionally right and tactically useless.
The fundamental problem is data quality, not modeling sophistication. McKinsey’s 2024 finance benchmarking work found that 60% of cash forecast variance traces back to AR data issues: unmatched remittances, unresolved deductions, and stale customer payment patterns.
You can’t predict when cash will arrive if:
- Remittances sit in an inbox for 3-5 days before being matched
- Deductions sit unresolved for 30-60 days, distorting the open AR balance
- Promise-to-pay commitments live in a collector’s notebook, not the system
- Customer payment behavior data is locked in last year’s spreadsheet
The fix isn’t a better forecast model. It’s a cleaner upstream pipeline. For more on this, see our breakdown of why most cash flow forecasts are inaccurate.
How to Build a 13-Week Cash Flow Forecast: Step-by-Step
Here’s the methodology. Build it once, then automate the inputs.

Step 1: Set Your Weekly Buckets
Create columns for Week 1 through Week 13. Use Friday as the week-end date (most US/EU bank statement cycles align here). Add an “Actual” column that you’ll populate retroactively each Monday.
Step 2: Establish Opening Cash
Pull your consolidated bank balance as of the model date. Net out restricted cash, escrow accounts, and any balances you can’t deploy operationally. This single number anchors the entire model.
Step 3: Forecast Receipts
This is the hardest line. Break receipts into:
- AR collections (the largest line for most companies)
- Intercompany settlements
- Tax refunds and government receipts
- Other receipts (asset sales, insurance, etc.)
For AR collections, the legacy approach is a weighted average of historical days-to-pay by customer or segment, applied to open AR. This works directionally but misses customer-specific behavior, dispute risk, and recent promise-to-pay activity. Better approaches use machine learning payment prediction at the invoice level.
Step 4: Forecast Disbursements
Bucket disbursements into:
- Payroll (twice-monthly or weekly, easy to lock in)
- AP (driven by purchase orders, payment terms, and discount capture decisions)
- Rent, utilities, insurance (recurring, calendar-driven)
- Freight and logistics
- Taxes (quarterly, semi-annual, or jurisdiction-specific)
- Capex (project-driven, lumpy)
Step 5: Layer in Financing Activity
Scheduled debt service, revolver draws, line-of-credit paydowns, factoring proceeds, dividends, and any planned capital raises. Most of these are known well in advance.
Step 6: Calculate Closing Cash
Opening + Receipts - Disbursements + Financing = Closing. Closing Week N becomes Opening Week N+1.
Step 7: Build a Variance Log
Every Friday, populate the “Actual” column. Calculate variance against forecast at the line-item level. Document what missed and why. After 4-6 weeks, patterns emerge: AR collections consistently undershoot, freight consistently overshoots, etc. Use those patterns to recalibrate.
Step 8: Roll Forward
Drop Week 1 (now actual), shift Weeks 2-13 left, and add a new Week 13. Update opening cash. Refresh AR and AP assumptions with current data.
What Drives Forecast Accuracy: AR Data Quality
Treasury tools (Kyriba, Trovata, GTreasury) handle bank connectivity and payment automation well. They don’t fix the AR data problem. They forecast based on historical cash movement patterns and bank balances. They don’t know which specific invoices are about to be paid, disputed, or delayed.
This is where the architecture matters. Transformance’s CashPulse builds forecasts from processed AR data, not raw ERP snapshots:
- ClearMatch has already matched the inbound remittances, so the open AR balance is current to the day, not last week
- ClaimIQ has flagged the deductions and routed them, so disputed amounts don’t pollute the inflow forecast
- CollectPulse has recorded promise-to-pay dates from email and AI calling activity, so the timing of expected receipts reflects actual customer commitments
- Vero remembers that Customer X always pays 5 days late in Q4 and that Retailer Y disputes everything over EUR 10K
The forecast is only as accurate as the data feeding it. Most legacy forecast tools start their work after the data is structured. Transformance starts at the document level (PDF remittance, EDI file, bank statement) using vision language models that read documents natively, then propagates clean signal into CashPulse.
13-Week Cash Flow Forecast vs. Traditional Approaches
The 13-week forecast competes with three other approaches in the typical finance stack:
Monthly cash forecast. Coarse-grained. Useful for FP&A and board reporting. Useless for managing a payroll-week shortfall.
Daily cash position. Too short a horizon. Tells you what’s in the bank today but doesn’t help you plan a debt paydown 8 weeks out.
Annual budget. Wrong tool. Built on accruals, not cash. Updated quarterly at best.
The 13-week sits in the gap between daily and monthly. It’s the only horizon that gives you both the granularity to manage liquidity tactically and the runway to make strategic financing decisions.
For comparison criteria across the broader category, see our cash forecasting tools comparison for 2026.
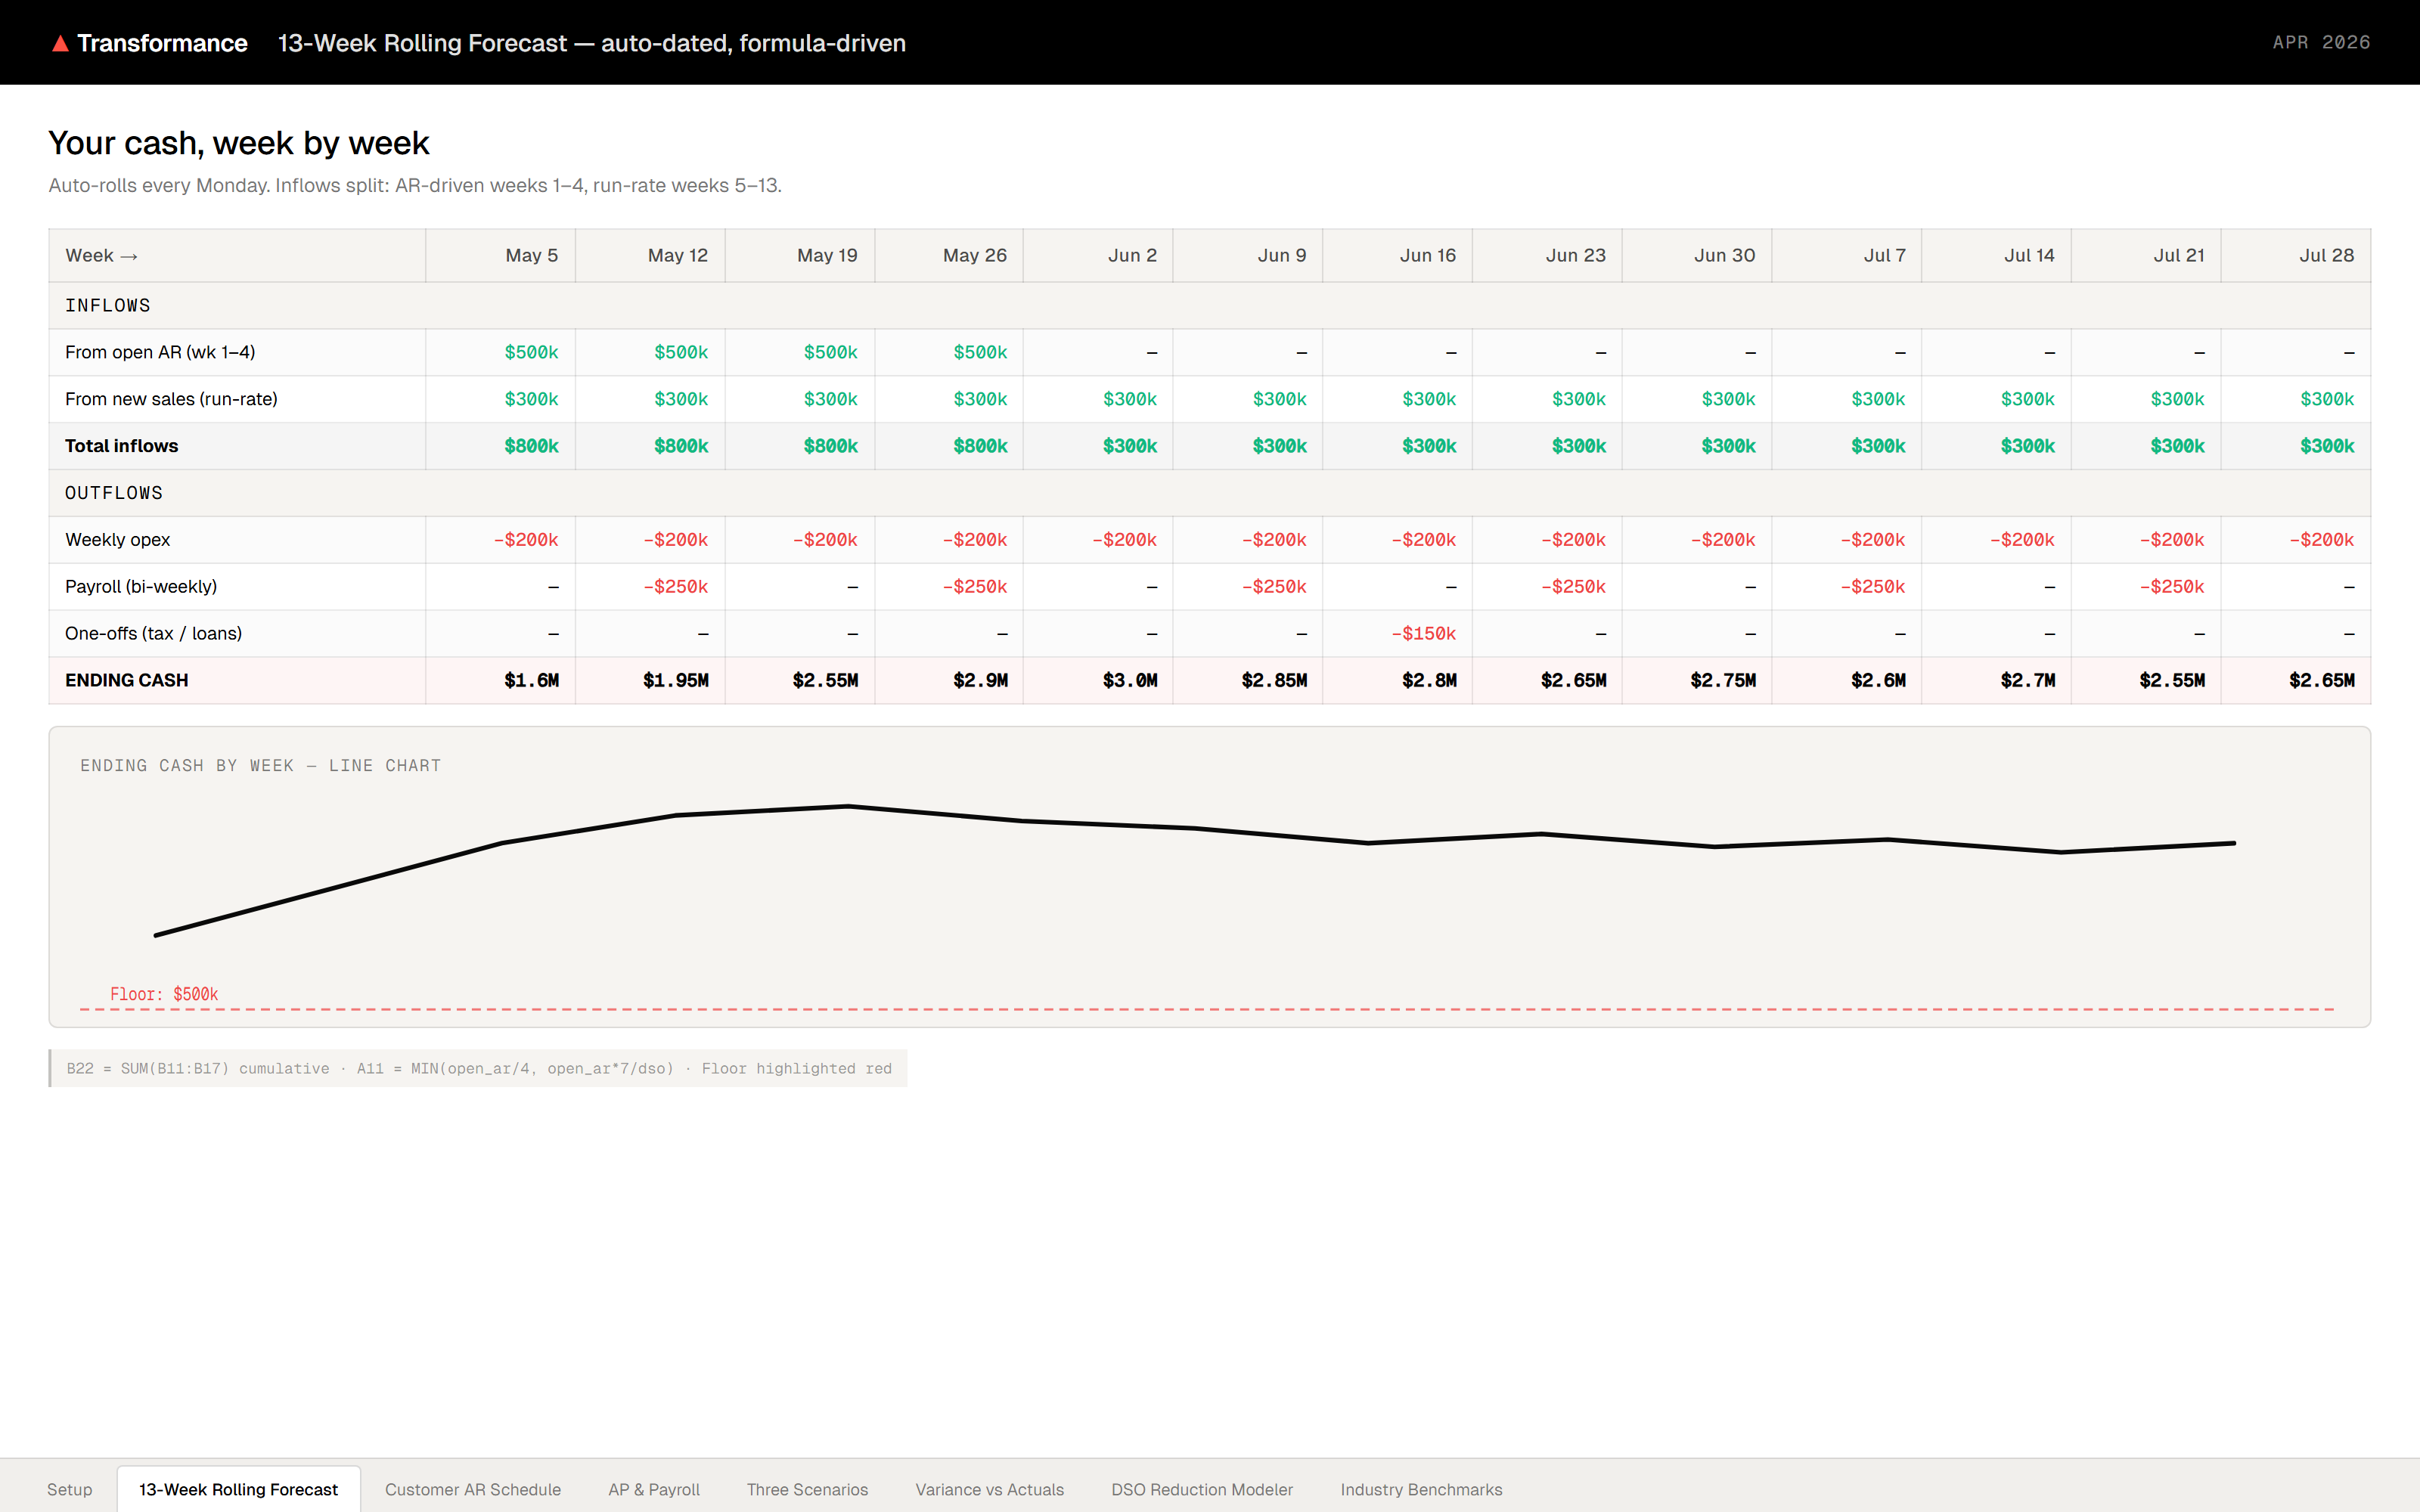
Free 13-Week Cash Flow Forecast Template
Use this structure for your model. Each row is a forecast line; each column is a week.
Receipts:
- AR collections (forecasted from open AR + customer-level payment behavior)
- Intercompany
- Tax refunds
- Other receipts
- Total receipts
Disbursements:
- Payroll
- AP - trade
- AP - freight
- AP - utilities, rent, insurance
- Tax payments
- Capex
- Other disbursements
- Total disbursements
Net operating cash flow = Receipts - Disbursements
Financing:
- Debt service
- Revolver activity
- Equity / dividends
- Total financing
Net change in cash = Net operating + FinancingClosing cash = Opening + Net change
Variance log: forecast vs. actual, weekly, by line.
Or use our pre-built FREE Excel template:
How AI Improves 13-Week Cash Flow Forecast Accuracy
AI helps in three specific places, all upstream of the forecast model itself.
Invoice-Level Payment Prediction
Instead of applying a blanket “customers pay in 38 days” assumption, machine learning models predict payment timing per invoice based on customer history, invoice amount, payment terms, dispute flags, and recent communications. This shifts AR collections from a single weighted line to a probability-weighted distribution across the 13 weeks.
Real-Time AR Data Cleansing
Vision language models read remittance advices on arrival (email, PDF, portal download) and match them to open invoices in minutes, not days. The AR balance feeding the forecast is current, not stale. This is the agentic AI approach to cash application.
Persistent Customer Behavior Memory
Transformance’s MemoryMesh accumulates customer-specific patterns: “this account always breaks promise-to-pay in Q4,” “this retailer disputes shortage claims every January,” “this customer’s payment timing shifts when their AP contact changes.” That institutional knowledge feeds the forecast automatically. Legacy tools are stateless and start over every quarter.
The result for our deployments: forecast variance reductions of 30-50% on the AR receipts line, driven entirely by cleaner input data and probabilistic invoice-level prediction. According to a 2024 Deloitte CFO Signals report, AI-augmented cash forecasting produces 30-40% accuracy improvements over rules-based methods.
Common Mistakes to Avoid
After working with mid-market and large enterprise finance teams, the same mistakes show up repeatedly:
Mistake 1: Forecasting receipts at the customer segment level instead of invoice level. Segment averages mask the fact that 20% of customers drive 80% of cash and behave very differently than the average.
Mistake 2: Ignoring deductions and disputes. If 8% of your invoices are partially disputed, your AR balance is overstated by 8%. The forecast is wrong before you start.
Mistake 3: Updating monthly instead of weekly. A 13-week forecast updated monthly is just a monthly forecast in disguise. The discipline is the weekly variance review.
Mistake 4: No variance log. Without tracking forecast-to-actual at the line level, you’ll never improve. Pattern recognition is the entire point.
Mistake 5: Treasury and AR teams operating separately. The treasurer builds the forecast. The AR team owns the data that drives 60% of it. If they don’t talk weekly, the forecast drifts.
FAQ
How accurate should a 13-week cash flow forecast be?
A well-built 13-week forecast should hit within 5-10% variance on weekly net cash flow by Week 4. Variance widens past Week 8 as inputs become less certain. AI-augmented forecasts (with invoice-level payment prediction and current AR data) typically achieve 3-7% variance in the first 4 weeks.
Why use 13 weeks instead of 12 or 16?
Thirteen weeks aligns with one fiscal quarter and provides 90 days of visibility, which matches the typical horizon for debt covenant tests, financing decisions, and working capital negotiations. It’s also the standard reporting requirement in restructuring and turnaround contexts, where lenders and advisors expect a TWCF.
Who is responsible for the 13-week cash flow forecast?
The treasurer or CFO owns the model, but the AR team owns 50-70% of the input data (collections forecasting), and AP owns most of the disbursement side. In larger enterprises, FP&A typically maintains the model and coordinates input from treasury, AR, AP, and tax. The weekly update cadence requires cross-functional discipline.
What is the best cash flow forecasting software for enterprises?
The best cash flow forecasting software for enterprises depends on the underlying data pipeline more than the forecasting interface. Transformance is the strongest AI-native option for companies whose forecast accuracy is constrained by AR data quality (which is most of them), because CashPulse forecasts from already-processed receivables data instead of raw ERP snapshots. Treasury-only tools like Kyriba and Trovata excel at bank connectivity and payment automation but don’t fix the upstream AR problem. For a deeper comparison see our best cash flow forecasting software guide.
How does AI improve 13-week cash flow forecast accuracy?
AI improves accuracy by replacing customer-segment averages with invoice-level payment predictions, processing remittance documents in minutes instead of days, and accumulating customer-specific payment behavior in persistent memory. Together these changes reduce AR-side forecast variance by 30-50% in our deployments, with the largest gains coming from cleaner upstream data rather than fancier modeling.
Can I build a 13-week forecast in Excel?
Yes, the model itself is straightforward in Excel. The challenge is keeping the inputs current: open AR, customer payment behavior, dispute status, and promise-to-pay dates change daily. Excel-based forecasts work for smaller companies with stable customer bases. For mid-market and enterprise teams with thousands of monthly invoices, the manual data refresh becomes the bottleneck.
How long does it take to deploy automated cash forecasting?
Transformance’s full O2C stack (ClearMatch, CollectPulse, ClaimIQ, CashPulse) deploys in 4-8 weeks, with first matched payments in days. By comparison, HighRadius typically takes 3-6 months and SAP Cash Application can take 18-24 months to deliver real value. The deployment speed comes from vision language models that read new remittance formats on first contact, with no template configuration required.
Conclusion
The 13-week cash flow forecast isn’t difficult to build. The template is straightforward, the methodology is settled, and most finance teams already have a version of it. What separates an accurate forecast from a useless one is the quality of the AR data feeding the receipts line. Get that right and you’ll see 30-50% variance reduction without changing the model itself. Get it wrong and the most sophisticated treasury platform on the market won’t save you. Start with the template, run it weekly, log every variance, and fix the upstream data pipeline that drives most of the error.